Broken Fang Gloves statistics
4 skinsHow the Broken Fang Gloves skin market works: price trends, price bands, how much StatTrak™ adds, where it’s cheaper to buy and which years the skins came out.
What changed this week
Dec 8 – Dec 14- −1.3%Broken Fang Gloves index: skins got cheaper on average this week.
- +9.8%Jade leads the gains among liquid skins.
These lines are built by fixed rules from prices and volumes over 7 days; skins with fewer than 20 sales a week don’t count as signals.
Compared with other gloves
index over 30 daysBroken Fang Gloves ranks #1 of 5 by 30-day index change: the best performance among its peers.
Price distribution
By typical skin price: how many models fall into each band
- up to $1.000 skins0%
- $1.00 – $100 skins0%
- $10 – $1000 skins0%
- $100 – $1,0004 skins100%
- from $1,0000 skins0%
Marketplace spread
Field-Tested price on 4 marketplaces, skins by sales
| Skin | Steam | Tradeit | Youpin | CSFloat | Spread |
|---|---|---|---|---|---|
| Yellow-banded | $56 | $40 | $40 | $41 | −29% |
| Needle Point | $55 | $41 | $41 | $40 | −27% |
| Unhinged | $61 | $47 | $45 | $46 | −25% |
| Jade | $84 | $64 | $61 | $61 | −28% |
Green marks the cheaper price. Prices on the Steam Community Market are usually higher because of fees and funds that can’t be withdrawn. Spread is how much cheaper the cheapest marketplace is than the most expensive one. Only trusted marketplaces are shown.
Most expensive
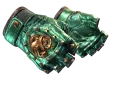
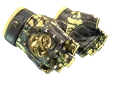
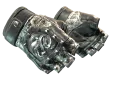
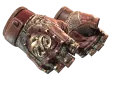
Most affordable
Prices are the 7-day Steam Community Market median and listings on trusted third-party marketplaces, updated hourly. The index is calculated once a day from daily prices.